Honeycomb
Event-driven observability built for high-cardinality debugging.
About
Honeycomb is an observability platform built around wide, high-cardinality events rather than pre-aggregated metrics. Engineers store full request context and slice it by any attribute to find which users, endpoints, or builds are behind a problem, using tools like BubbleUp to surface which attributes differ between slow and normal requests. It natively supports OpenTelemetry for traces, metrics, and logs, including telemetry enriched with AI-specific fields like model name and token usage.
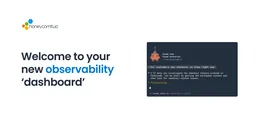
Its Honeycomb Intelligence platform added an AI-guided dashboard called Canvas that lets developers ask observability questions in natural language, exploring telemetry data and surfacing anomalies in real time. A free plan covers up to 20 million events per month, with Pro starting around $150 per month. Honeycomb is strongest for trace-first debugging and is often paired with a separate metrics backend.
What it can do
- High-cardinality event storage for open-ended investigation without predefined dashboards
- BubbleUp analysis surfacing which attributes differ between good and bad requests
- Native OpenTelemetry support for traces, metrics, logs, and AI/LLM telemetry
- Canvas, an AI-guided dashboard for natural-language observability questions
Setup
Create an account at honeycomb.io, instrument services once with OpenTelemetry or Honeycomb SDKs, and start querying events.
Prerequisites
Application services to instrument; OpenTelemetry instrumentation or Honeycomb's SDKs.
Use cases
Works with
Trust score — 8/10
Scored 8/10 (verified tier, metrics-v1). Evidence: Verified via vendor site/docs/GitHub and reputable coverage, wave 97; Trending score 84/100 from researcher assessment.
Sources
Every fact above was checked against these sources. Where a claim comes from the provider and couldn't be independently verified, the text says so.